


This is part of a series of posts sponsored by VMware. Read my disclosure statement here.
You’ve got vROps installed after reading my last post on how to do it. Great! Now what?
Now we need to configure it to do things. This is both really easy, and also a little daunting. vROps is huuuge. It can do a lot of things, so it can be hard to know where to begin. Helpfully, vROps come pre-configured with a bunch of useful things so it starts helping you straight away.
Point vROps at vCenter
To manage your VMware environment, you’ll need to point vROps at a vCenter somewhere, since that’s the source of all the information that vROps needs. That means adding a vCenter Adapter, like this:

You’ll need credentials that provide admin levels of access to vCenter so that it can both read in information, and perform actions (which we’ll see more of in a moment).
vROps will merrily discover your environment and start monitoring a bunch of in-built metrics, like the usual resource utilisations (CPU, memory, disk, I/O) and a bunch of other things besides. Then it’ll populate the main dashboard, which will look something like this:

A word of warning: have a nice big monitor. There is so much stuff crammed into the layout of vROps that you’ll need the screen real-estate to avoid having to scroll a lot, or close off sections of the screen. The look and feel is very much the same as vCenter and other similar VMware tools, so experienced admins will feel right at home.
The vROps View of the World
vROps measures a bunch of things (metrics) which it can then make sense of using Symptoms and Alerts. There are a lot of them, and this is just those that are built into the default install.
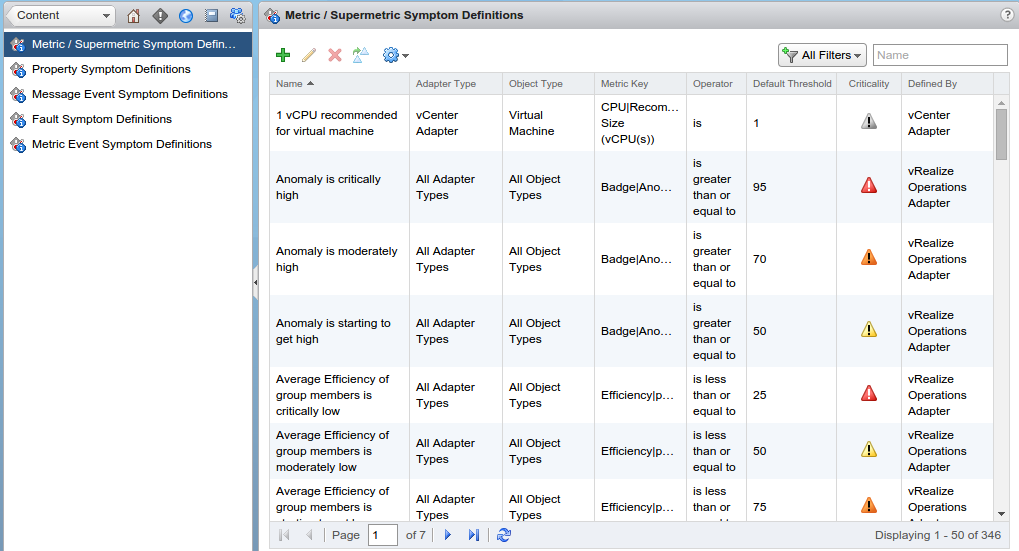
vROps built in Symptoms

vROps built in Alerts
Basically, a Symptom is a “something is wrong” indicator, and an Alert links the “something is wrong” of a Symptom to “Why should I care?” and “What do I do about it?”
An Alert can affect one our three main areas of interest on the main dashboard: Health (I’m sick and need a doctor), Risk (you might get sick, join a gym and eat less cheese), and Efficiency (it takes you 3 days to walk a kilometre).
Adding Alerts
You can add your own symptoms and alerts, of course! Here’s one I added to my test lab. First the Symptom:
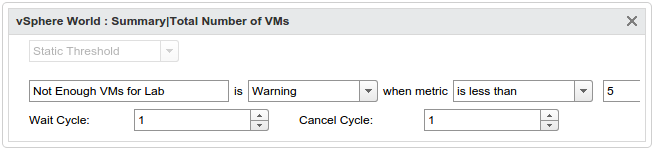
A custom symptom detecting too few VMs in my lab.
and then a corresponding Alert.

This alert links a Symptom (not enough VMs) to say that it impacts the Efficiency of my lab, and is Immediate criticality (super important). Also, it’s a compliance type alert, because it’s not really a health indicator, nor a risk, but affects how useful my lab is.
There are 5 VMs in my lab, so let’s see what happens if we change the threshold number to 10:

Only 5 VMs in the Lab! Oh no!
Ta da! vROps has detected that there aren’t enough VMs, and has given us a recommendation for how to fix it.
And that’s how it works for everything else. If a VM starts using more CPU than usual, and it’s too much for a node, vROps can tell you. If a node’s network is too busy, or you start to run out of disk space, vROps can tell you that, too. Not only that, it can tell you what to do about it. This looks great for building up a knowledge base of what to do when symptoms occur so you spend less time Googling for answers to common problems.
Some Confusion
The number of knobs you can turn with this tool makes it a bit challenging to use well. For example, when I configured my alert, it shows up in the vSphere World view, but the top level dashboard shows all green. It’s not obvious how you get the alert to show up at the top level, which I expected it to do by default.
I’d also want to have more pre-configured packs of alerts available, either from VMware or other vendors, otherwise you’ll have to spend a lot of time manually clicking around to set up your own alerts, and that’s a lot of effort to both set up to start with, and to maintain later. It’s the sort of situation where you don’t know what you’re doing, so you try things without realising the long-term implications (hello naming conventions!) and then there’s a lot of technical debt to go back and fix it all. You need to have the discipline to try things for a while, learn a lot, and then start afresh with the real installation.
It’d be great if you could share these collections of Alerts with other users so that we don’t all have to reinvent the same wheel over and over again, which is usually what happens with monitoring systems.
Trends
One of the more interesting bits of vROps is its available to monitor trends. After you have a baseline of ‘normal’ behaviour, vROps can detect things like abnormally fast storage consumption for datastores and VMs, alerting you to potential issues in the environment. It’s much better to notice in plenty of time that SQLServer is going to run out of space for transaction logs than to have to restore it from backups after it crashes hard.
We’ll come back and look at the environment in a couple of weeks when we have some more historical data to play with, and see what vROps can tell us about a running environment, rather than a brand new one.
Read the next instalment in this series: part 3, vROps In Practice: Review After A Month.
Pingback: Newsletter: July 25, 2015 | Notes from MWhite